
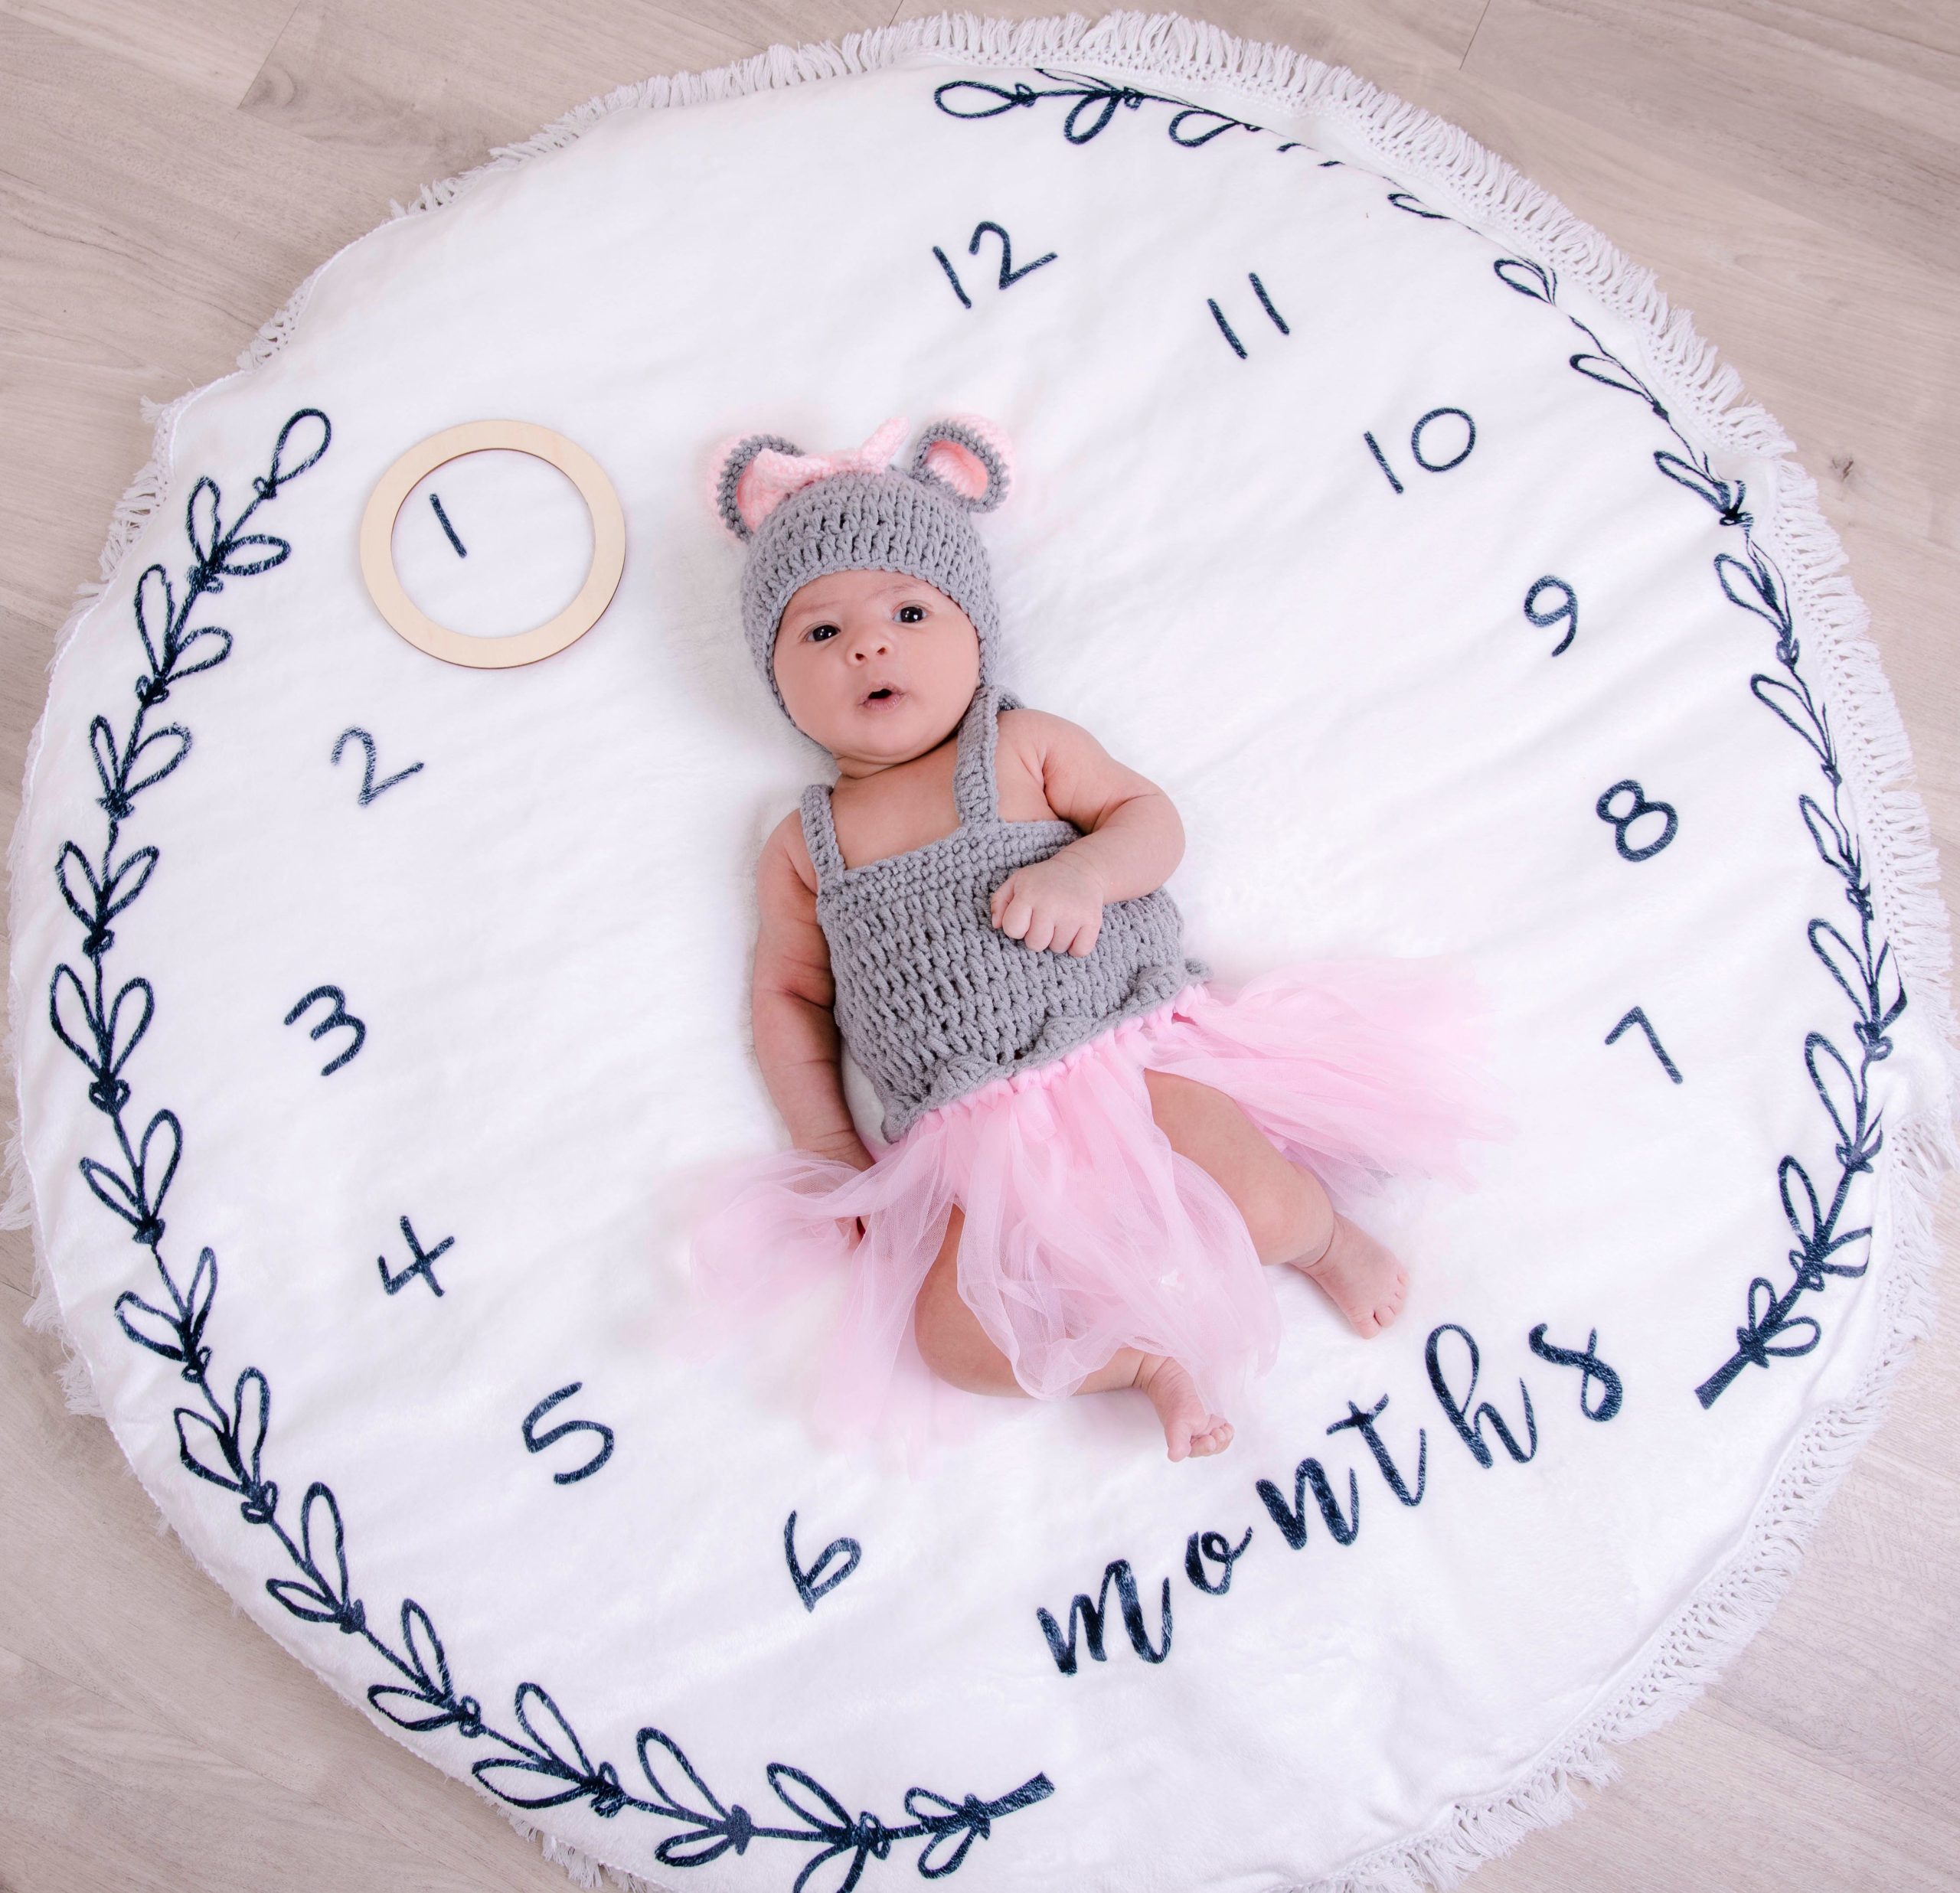
A baby milestone tracker works best when it does two jobs at once: it helps you remember the little breakthroughs, and it gives you an orderly place to record measurements from well-child visits. Those are related, but they are not the same thing. A first laugh belongs in the memory column; weight, length, and head circumference belong in the health record.
The visual chart below is designed to hold both without turning your baby’s development into a competition. You can make a first version in a few minutes, print it for the nursery, or keep it as a digital page that grows with your child.
Start with two lanes, not one crowded timeline
Before opening a design tool, split the page into two visual lanes:
- Developmental milestones: smiles, sounds, rolling, sitting, reaching, crawling, waving, and other new skills.
- Physical growth: the weight, length, and head-circumference measurements recorded by your healthcare professional.
The CDC defines developmental milestones as things most children, or at least 75%, can do by a certain age. Its checklists cover how children play, learn, speak, act, and move, and are meant to be shared with a doctor or another provider. That makes them a useful reference for labels on your chart, not a pass-or-fail exam.
For physical growth, the CDC says growth charts are percentile curves used to track measurements, but they are not a stand-alone diagnostic tool. A decorative home chart should therefore show what was measured and when; it should not announce that a baby is “healthy” or “behind” based on one dot.
The five-minute build
1. Pick a time scale you can actually maintain
For the first year, monthly columns are usually the sweet spot. Weekly columns look wonderfully thorough on day one and become visual clutter by month four. If you want more detail, add a small date field inside each month rather than multiplying the number of columns.
Use the same sequence throughout: birth, 1 month, 2 months, 3 months, and so on. Leave a little extra space after 6 months, when many families begin collecting more movement, feeding, and communication notes.
2. Choose three measurement rows
Use one row each for:
- Weight
- Length
- Head circumference
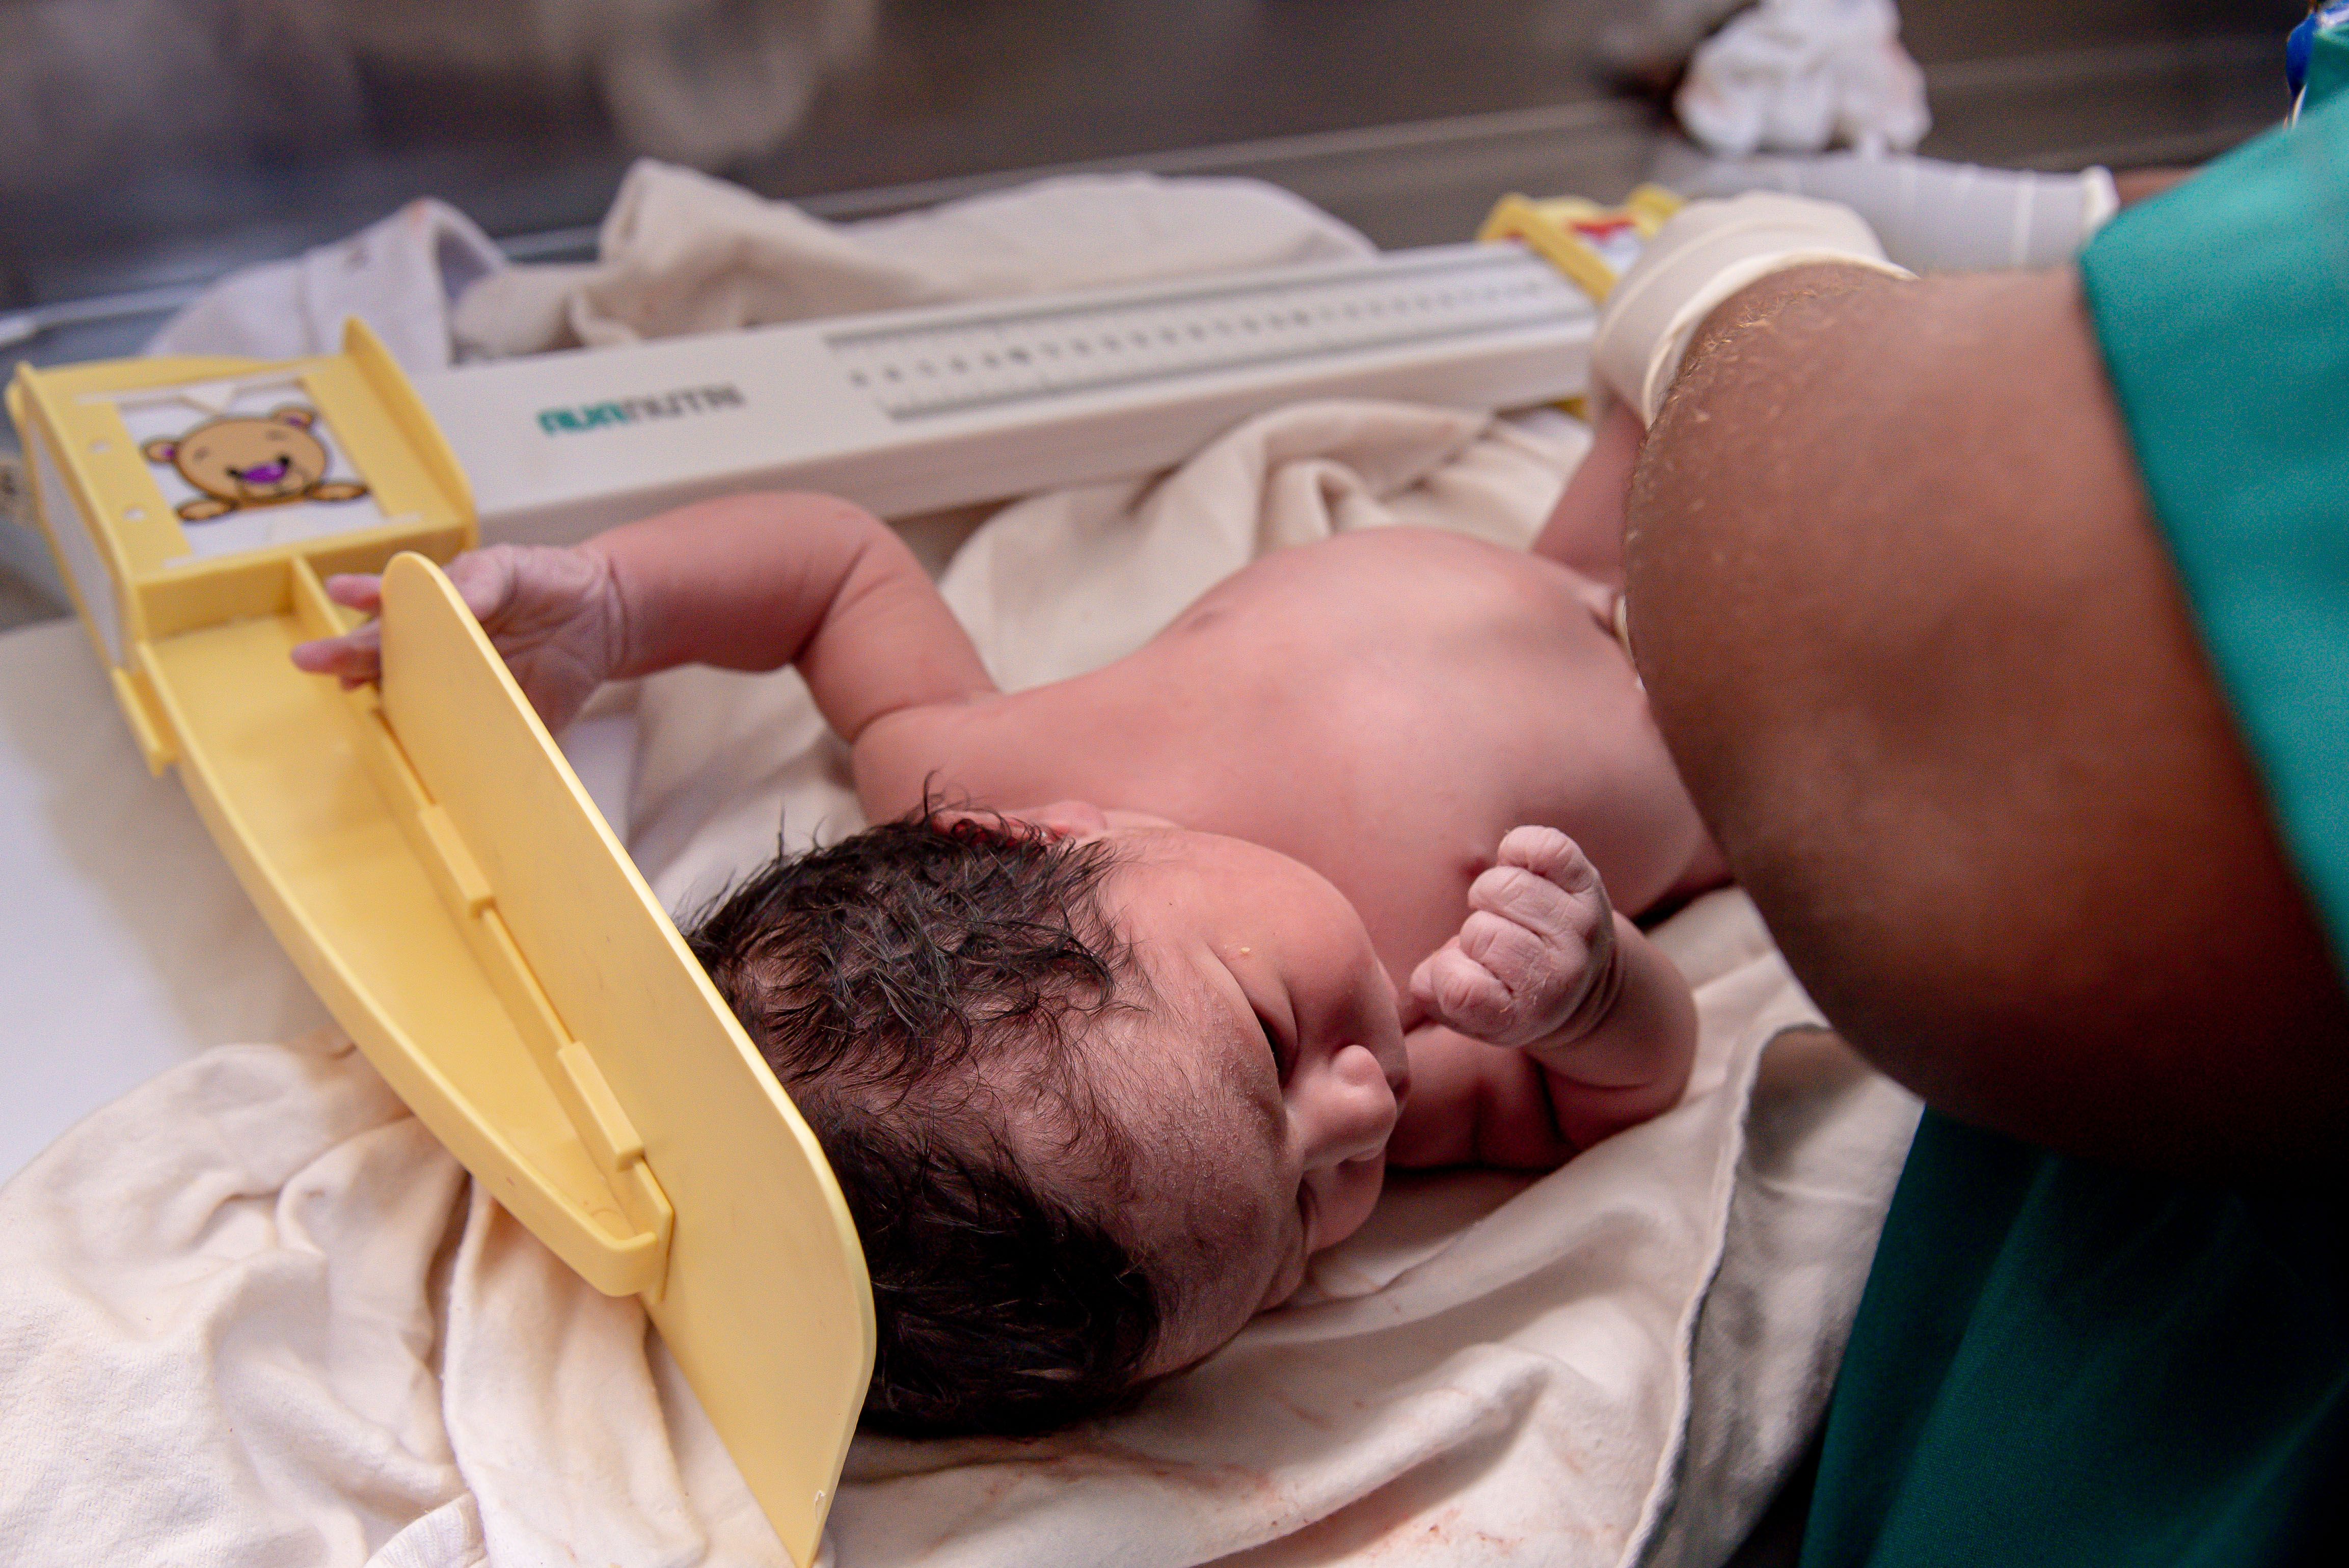
Copy measurements from appointment paperwork rather than weighing or measuring repeatedly at home to chase a smoother-looking line. For U.S. infants from birth through age 2, the CDC and American Academy of Pediatrics recommend WHO growth tools; at age 2, clinicians generally transition to CDC growth charts. A clinician’s chart may also include percentiles, so leave room for the percentile noted at the visit.
3. Turn milestone categories into visual markers
Instead of writing a sentence in every cell, give each type of event its own symbol or color:
| Chart element | Simple visual treatment | Example entry |
|---|---|---|
| Social and emotional | Warm-color dot | Smiled at familiar voice |
| Language and communication | Speech-bubble icon | Made sounds back to you |
| Cognitive and attention | Star or small eye icon | Watched a moving toy |
| Movement and physical skills | Arrow or action icon | Held head up during tummy time |
| Growth measurement | Solid line or square | Weight recorded at visit |
Keep the legend visible at the bottom. It turns a pretty poster into a chart someone else can understand six months later.
4. Build the chart digitally before decorating it
A spreadsheet is fine for the data, but a simple visual design is easier to adjust in a chart or presentation tool. If you want a quick starting point, use Adobe’s bar chart maker to save time, then replace generic labels with your baby’s months and milestone categories. You do not need a bar chart to compare babies; use the tool as a fast canvas for blocks, labels, and a legend.
Use one calm background, one dark text color, and no more than four milestone colors. Oversized illustrations can make the page charming, but they also push the useful information into tiny type. My preference is a quiet grid with one photo or short note per month: it stays readable when printed and does not make ordinary months feel empty.
What to put in each month
A good monthly card needs only four ingredients:
- Date or age: use the age at the time of the event, plus the calendar date if you want a precise memory.
- One or two new skills: describe what happened plainly, such as “rolled from tummy to back.”
- One physical measurement entry: add the measurement from a visit, with units and the date it was taken.
- One human detail: a favorite song, the expression your baby made, or who happened to be there.
That final detail matters more than it sounds. “Started waving” will jog your memory; “waved whenever the kettle clicked” will bring the room back.

Percentiles are a pattern, not a grade
A percentile is a comparison point on a reference chart, not a score a baby is trying to improve. A single percentile cannot tell the whole story, and the home version of your chart cannot replace the interpretation of a pediatric professional.
Record the number exactly as it appears in the clinical record and, if provided, the percentile. Then look for the broader pattern over time. If a measurement or developmental skill concerns you, bring the chart to the appointment and ask directly what should be watched next. The CDC recommends discussing milestone concerns with a child’s doctor and asking about developmental screening when needed.
There is an extra wrinkle for babies born early. The CDC’s online milestone checklist says to use corrected age when a baby was born more than three weeks prematurely. Put both ages in your chart, for example “5 months chronological / 3 months corrected,” so relatives do not accidentally read the timeline as a prediction.
Make the display part of the room
Once the data is clear, give the chart a home. A nursery wall, the inside of a closet door, or a slim frame near the changing area can work. Choose somewhere adults can read it easily but where the chart will not be exposed to moisture, direct sun, or a baby’s reach if it is framed with glass or small detachable pieces.

For a digital version, export a monthly PDF and keep the editable source file separate. Name files consistently, such as baby-tracker-2026-06, and back them up with the photos. The point is not to create a perfect archive; it is to make updates easy enough that you will keep making them.
Three rules that keep the tracker useful
- Do not fill gaps with guesses. If you cannot remember the exact day, write “around 4 months” rather than inventing precision.
- Do not compare children on the same line. A cousin’s date or a social-media checklist is not a clinical reference for your baby.
- Do not let the chart replace a conversation. Bring questions and measurements to regular visits, especially if a skill is lost, a concern persists, or a provider recommends follow-up.
The strongest baby milestone tracker is not the one with the most icons. It is the one that separates memory from measurement, shows the dates honestly, and leaves enough breathing room for your child to develop in their own order. Make the first version simple. You can always add a photo, a note, or a new row later; the moments you are trying to keep will not wait for a more elaborate template.